8
Our results

Our results

Operational and financial outlook

DMA 1

We are convinced that an outstanding economic performance will allow us to improve our clients’ loan conditions (price and benefit) and the service experience, as well as to generate a greater sense of belonging within the Group, since employees are proud to be part of a company with exceptional results and in permanent growth.

We have clear policies, objectives and goals regarding economic performance, such as ROA, ROE, net income, UPA efficiency indicator, hedge indicator, Net margin, financial expenditure, total loan portfolio and the ratio of non-performing loans.

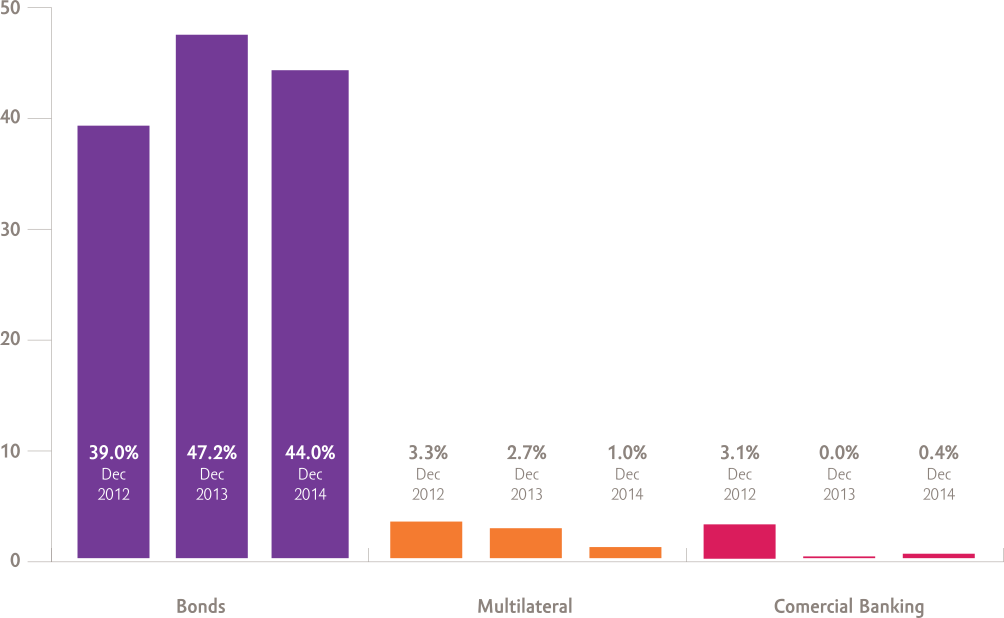
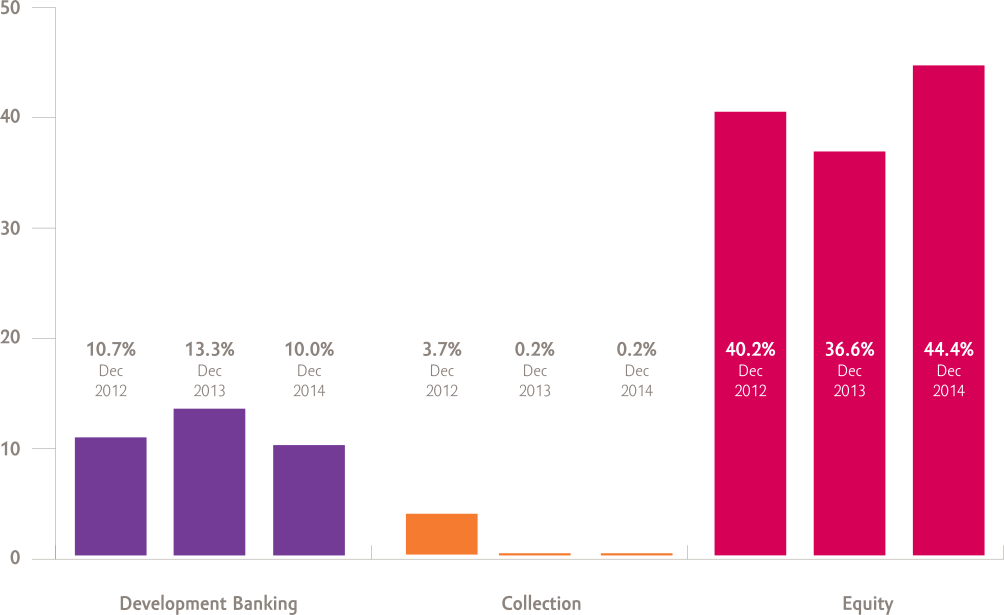
Budget control has a financial indicators’ dashboard which are reported to the corporate governance bodies (committees and Board) and to several external entities (rating agencies, BMV, sponsors, authorities and regulating parties) to monitor the progress against the established goals and objectives.

In the last year we achieved a portfolio loan increase of over 15% and the loan portfolio’s compound growth in the last three year has been more than 18%. Net profit at year’s close amounted to PS. 3,162 million, which implies a compound growth in the last three years superior to 16%. Also, Return on Equity (ROE) amounted to 29% and Return on Assets (ROA) was 11%.

During the last three years, the number of clients increased in over 400,000, at the end of December, 2014 we have almost 2.9 million clients. In addition, in the same period of time the number of employees increased substantially, going from 14,561 in December, 2011 to 18,999 in December, 2014.

Financial and operational results

G4-9, G4-EC1, G4-EC7, G4-EN31
Concept 2012 2013 2014 Variation 14/13 %
Clients 2’675,758 2’754,860 2’874,488 4.3%
Employees 16,601 19,339 18,999 -1.8%
Branches1 536 577 635 10.1%
Loan portfolio (millions) 18,161 20,706 23,951 15.7%
Average outstanding balance per client 6,787 7,516 8,332 11.0%
Non-performance loan ratio 2.88% 3.12% 3.28% 0.16 pp
(Millions)         
Loan portfolio interest 9,986 12,475 14,348 15.0%
Net sales N/A N/A N/A  
Income from financial investments (amount derived from interest on financial loans, shareholding dividends, royalties and direct income from assets) 116 115 103 -10.4%
Income from asset sales (tangibles and intangibles) 7 -117.9%
Interest income 10,102 12,590 14,451 14.8%
Interest expenses 718 818 822 0.5%
Financial margin 9,384 11,772 13,629 15.8%
Financial margin adjusted for risk 8,393 10,164 11,937 17.4%
Operating expenses 5,365 6,763 7,939 17.4%
Taxes 1,053 1,241 981 -21.0%
Community investments (pesos)        
Economic + in-kind donations 35’487,871 29’399,590 32’127,827 9.3%
One on one contributions N/A N/A N/A
Volunteering 1’432,902 394,508 1’126,352 185.5%
Service or equipment in-kind contributions 2’412,014 3’624,766 2’762,103 -23.8%
Donation, volunteering and programs directed to communities management expenses 1’153,754 1’410,888 757,635 -46.3%
Environmental protection expenses and investments (pesos)        
Waste and emissions treatment expenses 670,000 512,500 225,000 -56.1%
Prevention and Environmental management (Reforestamos, camellones and aventones) 1’405,055 780,194 789,987 1.3%
(Millions)        
Operating results 3,074 3,512 4,147 18.1%
Net results 2,021 2,271 3,162 39.2%
Average loan portfolio 16,308 20,359 22,801 12.0%
Average productive assets 18,352 22,399 25,442 13.6%
Operating margin = (operating results / average loan portfolio) 18.9% 17.3% 18.2% 0.9pp
Net margin = (net results / average loan portfolio) 12.4% 11.2% 13.9% 2.7pp
Operating margin = (operating results / average productive assets) 16.7% 15.7% 16.3% 0.6pp
Net margin = ( net results / average productive assets) 11.0% 10.1% 12.4% 2.3pp
Assets        
Cash and other investments 2,955 2,533 3,363 32.8%
Assets 22,833 25,362 30,543 20.4%
Liquidity (cash + other investments) / total assets 12.9% 10.0% 11.0% 1.0pp
Total loan portfolio 18,161 20,706 23,951 15.7%
Non-performing loan portfolio 523 645 785 21.7%
Fixed assets 733 976 921 -5.6%
Liabilities        
Total liabilities 14,189 16,419 18,483 12.6%
Liabilities with cost 13,128 15,222 16,083 5.7%
Stockholders' equity 8,644 8,943 12,060 34.9%
         
Net earnings per share (pesos) 1.2 1.4 1.9 35.7%
Average assets 20,249 25,025 28,726 14.8%
Average stockholders' equity 8,038 8,977 10,758 19.8%
ROA (net results / average assets) 10.0% 9.1% 11.0% 1.9pp
ROE (net results / average stockholders' equity) 25.1% 25.3% 29.4% 4.1pp
         
Book value per share (pesos) 5.2 5.4 7.3 35.2%
Share price at period’s close (pesos) 18.4 24.4 29.7 21.7%
Total shares for calculating EPS and BVS 1,662’382,704 1,648’211,536 1,648’211,536 0.0%
1 Includes Mexico, Peru and Guatemala.        

Economic Value

g4-9
Share variation 2012 2013 2014 Share variation compar c / gentera
  Pesos % Dollars
Share price on the year's last business day 18.4 24.4 29.7 5.2 21.4% 0.4
Exchange rate published on January 2, 2015 in the DOF 12.9658 13.0843 14.7414      
Number of shares 1,662’382,704 1,648’211,536 1,648’211,536      
Number of effective shareholders 5 5 5  
Loan portfolio (millions)
  2012 2013 2014
Mexico 14,887 16,447 18,961
Peru 3,147 4,045 4,7683
Guatemala 114 189 221
Total * 18,148 20,681 23,951
* In 2013, the loan portfolio, unlike the Financial Statements' portfolio does not consider a commercial portfolio for PS. 25 million.
2014 Income for interest
  Millons %
Mexico 12,907 89.3%
Peru 1,374 9.5%
Guatemala 170 1.2%
Total * 14,451 100.0%
Main indicators Mexico Peru Guatemala
2014 ∆ vs 2013 2014 ∆ vs 2013 2014 ∆ vs 2013
Non-performing loans / loan portfolio 2.66% -0.23pp 5.65% 1.65pp 4.97% 1.20pp
Hedge rate 175.0% -9.2pp 148.6% -63.1pp 106.1% -5.7pp
Portfolio percentage distributed by region and/or business unit Compartamos Banco Yastás Aterna Gentera Compartamos Financiera Compartamos S.A.
79.2% 0% 0% 0% 19.9% 0.9%
Main indicators Mexico Peru Guatemala
2014 ∆ vs 2013 2014 ∆ vs 2013 2014 ∆ vs 2013
ROAA 15.0% 2.0pp 4.4% 2.4pp 0.1% 5.8pp
ROAE 38.9% 4.0pp 33.7% 16.2pp 0.2% 6.1pp
Net income (millions)
2012 2013 2014
Mexico 2,051 2,496 3,233
Peru 94.08 76.08 205.79
Guatemala Does not generate income yet Does not generate income yet 0.77
Gentera, S.A.B. and subsidiaries 2,021 2,271 3,162

Economic value created, distributed and retained

g4-ec1
Concept (millions) 2012 2013 2014
Direct economic created value1 10,576 13,307 15,257
Economic distributed value2 7,446 9,136 10,071
Economic retained value3 3,130 4,171 5,186
Net result 2,021 2,271 3,162

1 Direct economic created value = net income + income from financial products + assets sale + other operating income, net.

2 Economic distributed value = sales costs + salaries + employees benefits + training + other financial expenses + taxes + dividends + interest payment + community investments.

3 Economic retained value = direct economic value created – economic value distributed.


Concept 2012 2013 2014
Number of clients 2'675,758 2'754,860 2'874,488
Financial margin (millions) 9,384 11,772 13,629
Operating efficiency 26.5% 27% 27.6%
Operation result (millions) 3,074 3,512 4,147
Net income (millions) 2,021 2,271 3,162

Funding

Bank Information Equity Commercial Banking Development Banking Multilateral Bonds Collection Total
Dec-12 40.2% 3.1% 10.7% 3.3% 39.0% 3.7% 100%
Dec-13 36.6% 0.0% 13.3% 2.7% 47.2% 0.2% 100%
Dec-14 44.4% 0.4% 10.0% 1.0% 44.0% 0.2% 100%
Peru Information Equity Commercial Banking Development Banking MultilateralFunds Investment Funds Total
Dec-12 14.8% 13.0% 30.2% 3.6% 38.4% 100%
Dec-13 13.1% 11.8% 35.8% 4.4% 34.9% 100%
Dec-14 17.5% 13.1% 23.2% 9.7% 36.5% 100%
  2013 2014
  Compartamos Banco Gentera Compartamos Banco Gentera
Accumulated efficiency Index 62.2% 65.8% 63.0% 65.7%
Stockholders' equity / Total assets 35.5% 35.3% 41.4% 39.5%
ICAP 27.8% N/A(Gentera is not a bank) 33.1% N/A